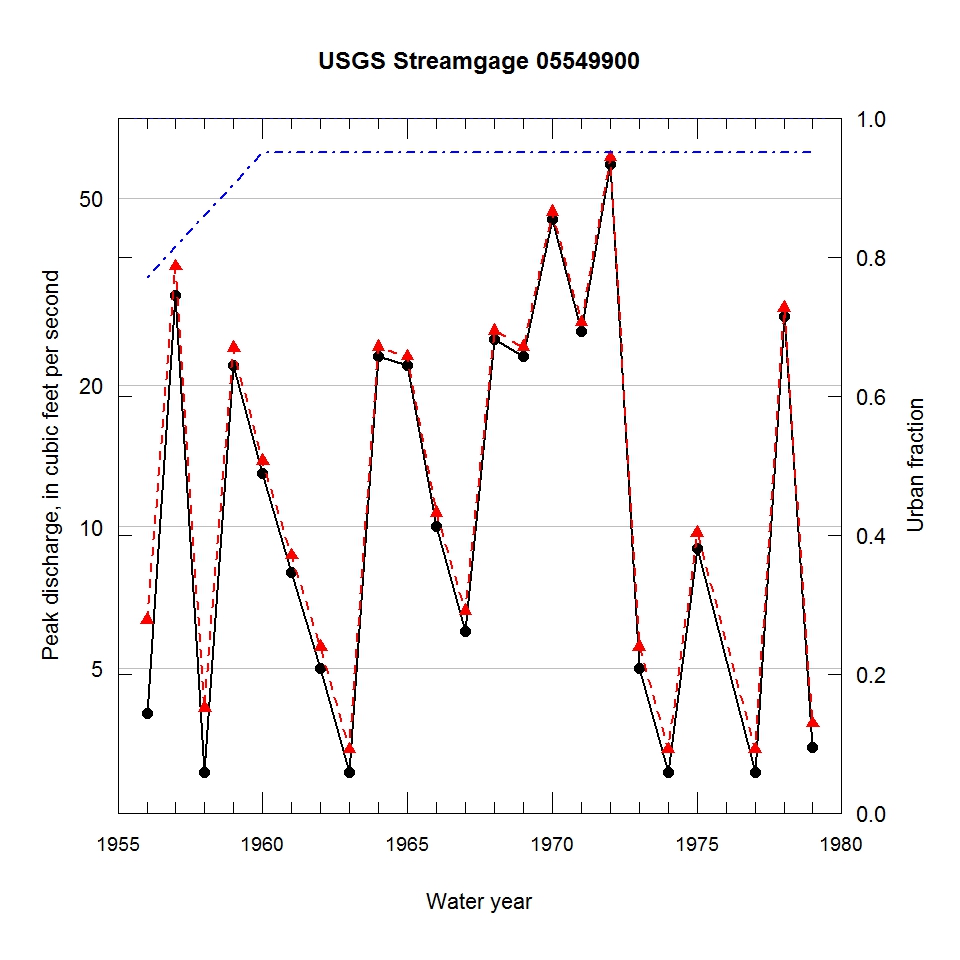
Observed and urbanization-adjusted annual maximum peak discharge and associated urban fraction and precipitation values at USGS streamgage:
05549900 FOX RIVER TRIBUTARY NEAR CARY, IL


| Water year | Segment | Discharge code | Cumulative reservoir storage (acre-feet) | Urban fraction | Precipitation (inches) | Observed peak discharge (ft3/s) | Adjusted peak discharge (ft3/s) | Exceedance probability |
| 1956 | 1 | -- | 0 | 0.770 | 0.364 | 4 | 6 | 0.977 |
| 1957 | 1 | -- | 0 | 0.815 | 2.162 | 31 | 36 | 0.022 |
| 1958 | 1 | 4B | 0 | 0.860 | 0.006 | 3 | 4 | 1.000 |
| 1959 | 1 | -- | 0 | 0.905 | 0.757 | 22 | 24 | 0.107 |
| 1960 | 1 | 2 | 0 | 0.950 | 0.543 | 13 | 14 | 0.567 |
| 1961 | 1 | 2 | 0 | 0.950 | 0.821 | 8 | 9 | 0.926 |
| 1962 | 1 | 2 | 0 | 0.950 | 0.351 | 5 | 6 | 0.986 |
| 1963 | 1 | 4B | 0 | 0.950 | 0.006 | 3 | 3 | 1.000 |
| 1964 | 1 | -- | 0 | 0.950 | 1.651 | 23 | 24 | 0.105 |
| 1965 | 1 | -- | 0 | 0.950 | 0.843 | 22 | 23 | 0.127 |
| 1966 | 1 | 2 | 0 | 0.950 | 0.358 | 10 | 11 | 0.803 |
| 1967 | 1 | -- | 0 | 0.950 | 0.006 | 6 | 7 | 0.971 |
| 1968 | 1 | -- | 0 | 0.950 | 1.223 | 25 | 26 | 0.073 |
| 1969 | 1 | -- | 0 | 0.950 | 0.793 | 23 | 24 | 0.105 |
| 1970 | 1 | -- | 0 | 0.950 | 0.762 | 45 | 47 | 0.011 |
| 1971 | 1 | -- | 0 | 0.950 | 0.905 | 26 | 27 | 0.063 |
| 1972 | 1 | -- | 0 | 0.950 | 1.063 | 59 | 61 | 0.003 |
| 1973 | 1 | -- | 0 | 0.950 | 0.716 | 5 | 6 | 0.986 |
| 1974 | 1 | 4B | 0 | 0.950 | 0.006 | 3 | 3 | 1.000 |
| 1975 | 1 | -- | 0 | 0.950 | 0.806 | 9 | 10 | 0.869 |
| 1977 | 1 | -- | 0 | 0.950 | 0.210 | 3 | 3 | 1.000 |
| 1978 | 1 | -- | 0 | 0.950 | 2.040 | 28 | 29 | 0.047 |
| 1979 | 1 | -- | 0 | 0.950 | 1.160 | 3 | 4 | 1.000 |

